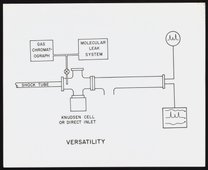
Diagram depicting air spectrum on scope
- 1960s

Diagram depicting air spectrum on scope, showing readings for nitrogen gas, oxygen, and carbon dioxide. This diagram is likely the output of a Bendix Corporation Time-of-Flight Mass Spectrometer, an instrument commonly used to identify qualitatively and quantitatively the atomic and molecular composition of inorganic and organic materials. The diagram is captioned "Figure 1," indicating that it appeared in a publication or report.
| Property | Value |
|---|---|
| Creator of work | |
| Format | |
| Genre | |
| Extent |
|
| Subject | |
| Rights | No Known Copyright |
| Credit line |
|
Institutional location
| Department | |
|---|---|
| Collection | |
| Physical container |
|
View collection guide View in library catalog
Related Items


Cite as
Bendix Corporation. “Diagram Depicting Air Spectrum on Scope,” 1960–1969. Photographs from the Bendix Time-of-Flight Mass Spectrometer Collection, Box 1. Science History Institute. Philadelphia. https://digital.sciencehistory.org/works/m039k506s.
This citation is automatically generated and may contain errors.
